Survival Guide To Trading The Stock Market Month Ends
 End of month trading is different from other trading days because several classes of market participants would join the game during this time. Long side only funds often make adjustments to their portfolios during the last three to five trading days of a month. Long term investors also review the performance of their portfolios around the same period to decide if adjustments are necessary. There are also the month end option players who actively seeking for trading opportunities.
As significant number of longer term players enter the stock market, the normal dynamics among the active traders and market makers will be temporarily disrupted. It is predictable that patterns emerge from this regular event. The important thing is to be aware of the patterns and take advantage of them in your trading.
Month End Markup Phenomenon
Many traders have heard of the end-of-month window dressing or the month end markup phenomenon. Many big name traders have written about it. Many of the studies that have been done, however, only show a slight bias of relatively stronger buying in the last few trading days of a month relative to the other trading days.
Is the month end markup really worth paying attention to?
Some people focus a lot on the terms markup and window dressing because people like to associate them with conspiracies and market manipulations. The truth is that not everyone participate in the stock market use shady tactics to manipulate the prices. More often than not, it is just the aggregated behaviour among the market participants driving the price to move in some predictable ways. As a trader, do no associate yourself with such beliefs as they can do more harm than good with your trading. What we should do is investigate and learn from the facts as always.
Let’s look at the some of the common beliefs about month end to see if they have any merit.
The Troublesome Definition of Month End
If you ask ten traders what month end is, you will likely get 5 to 6 different answers. Everyone somehow have their own interpretation of what month end is. When there is no agreed upon definition of the term, it is not possible to carry out meaningful discussion of month end biases.
I am going to offer my version of month end definition here so that there is no confusion going forward.
In general I consider month end is just the last two to three trading days of the month.
The days leading up to the month end matters but they are not part of the month end.
Finally, the days leading up to the month end start right after the option expiration of each month. Option expiration is the third Friday of a month.
The Myth of Month End Heavier Trading Activity Debunked
Following is the average daily volume of Emini S&P ordered by the trading day of the month since year 1999.

The following chart is the average since year 2010.

We are often told that we have to be aware of the pick up of trading volume going into the end of the month. The charts above going back to 1999 shows that but the one computed from 2010 does not. Why?
Not all months have 23 trading days. The number of trading days in a month can varies from 20 days (for February and December it can go as low as 18 days) to 23 days. Thus the generic approach used above which is based on the trading day of the month is not accurate even though that is what everyone does on the internet to showcase the bias.
Let’s analyze the trading volume by counting backward from the end of the month to see what happen.
The following chart is the average volume of the last 10 trading days since 1999.

Now, the same chart based on data since 2010.

The truth is that except the very last trading day of a month, the last few trading days of the month are consistently having below average daily volume for years.
The real spike in volume only happens on the last trading day of the month.
The key reason why people feel that there is an increase in volume is due to relative comparison. Notice from the charts that there is heavy trading every month going into the mid month option expiration. Once the option expiration is over, trading volume dropped significantly to the point that it is noticeable even by casual observations. Hence, traders in general have the illusion that trading volume suddenly pick up in the last few trading days of the month. It is the jump from very thin volume back to normal that deceived their perception.
Well, the mistake of analyzing volume from the beginning of the month obviously also contributed to the incorrect inference.
As a summary, do not read too much into the month end volume as a supportive argument for whatever signs you see S&P is heading. The norm for month end trading volume is not as exciting as some people think.
If you are wondering whether the Emini S&P trading volume can represent the overall trading activities in the stock market, you can check out the trading volume of SPY and the overall trading volume of of NYSE. They are eerily similar to each other. They look so similar you have to wonder if they are the same chart.
The Myth of Impartial Window Dressing Debunked
From the last section, it is clear that we cannot analyze month end behaviour using serial trading day classification because that will not provide an accurate picture of what happens at the end of the month. We have to look backward from the end of the month to analyze the data properly.
Following is a chart of the Emini S&P average net gain (loss) by holding onto the last N trading days of a month since 1999.

In the chart, the column labelled 10 is the average gain for holding Emini S&P for the last 10 trading days of a month.
By the same token, the column labelled 1 is the average gain for holding Emni S&P over only the last trading day of a month.
Notice there is no visible gain for either holding the last trading day or the last 2 trading days.
Could this be wrong?
Let’s check the statistics since year 2010.

The last trading day of the month actually produces an average loss over the past few years.
The statistics for holding Emini over the last 10 trading days to the last 7 trading days are also not showing any improvements either.
The only significant bias that survives the last 4 years is a mild average gain of 2 to 3 points if you hold Emini over the last 3 to 5 trading days of a month.
If you believe that there exists an impartial window dressing on majority of the stocks in the stock market, this is definitely a very rude awakening.
The Truth Be Told
Many readers are probably very disappointed at this point. After all, believing in Santa Claus is more pleasant than knowing that he may not exist at all. Just like many other myths that has certain element of truth, the Window Dressing phenomenon is real to certain extend.
Window dressing is the practice of unloading some under performing stocks from a portfolio and then buying ones that the fund managers like to accumulate at the end of a month. It is just a normal practice for even retail investors to review their portfolio and make adjustments based on the changes happening in the stock market. Hence window dressing is not necessary an intentional act of market manipulation by individual fund managers.
After all, this act of selling and buying various stocks within a short period of time will often offset each other’s impact on the S&P 500 index. Thus even though the practice of month end review and adjustment really exists, the net effect is not always positive for the stock market and the indices. The statistics I have presented above clearly illustrating this point.
Component Weighting Matters
Although there is no noticeable biases to lean on for the last few trading days in general, it does not mean that there are no biases to lean on at all. The most important thing to remember is that the month end adjustments made by the fund managers will induce significant trading volume as we know happening on the last trading day of the month. Thus if you can tell which group of stocks will mainly be sold and which group of stocks will mainly be bought, you can get a good gasps of of the potential direction of the index based on the relative weighting of the stocks that are likely to be sold and those likely to be bought.
In general, if the stocks to be sold weight less than the ones to be bought, the index gets a lift.
If the stocks to be sold weight more than the ones to be bought, the index drops.
Here is an interesting take on the practice of month end adjustment. As majority of long term funds buy a similar basket of stocks based on fundamental information, their favourites of the month tend to be similar too. This means their end of month adjustments to their portfolios may not share the same list of stocks to sell, they are very likely to chase after the same group of stocks when they are bargain hunting. Hence, window dressing effect is created out of this predictable coincidence.
Long Side Funds Need To Sell First To Raise Cash
It is often forgotten by traders that long side funds almost always committed majority of their cash to work. Unless the fund managers have some side money to spare by month end, they need to unload the stocks they do not want first so that they have the cash necessary for their shopping spree. The aggregated effect from this behaviour among all the long side funds manifest into a very short, but noticeable selling before the actual month end.
Some readers would have this figured out already based on the average net gain charts above. It is the 8th day from month end to the 6th day from month end that this selling usually occur, should it occurs. Thus if we see such selling on a concentrated group of stocks while the market leaders and biggest components are not affected. You know the stock market indices will benefit from the shopping spree within days after the selling.
Bull Market And Bear Market Considerations
The end of month price behaviour described in this article so far is consistent in both bull markets and bear markets in the past. It may sound unbelievable but it should not be a surprise if you look at the historical average net gain over the last two trading days of a month. The average net gain of that period is effectively neutral.
The last two trading days of a month on average is not leaning on either directions. The month end activities is a time of cross currents, not directional bias like the beginning of a month where inflow of money into long side funds has been a stable recurring event. The net effect from mixed market conditions being neutral is reasonable.
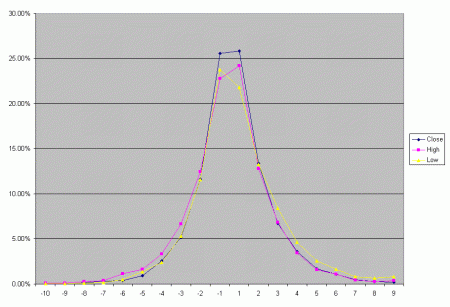
Month End Relative Closing Position
I have posted a chart comparing the month end closing level relative to the range of the month against the option expiration closing level relative to the range of the option cycle. Here is the chart again.

The article written at the time focus on the option expiration week closing position property.
This time, I am going to discuss about the month end closing position characteristics.
From the chart above, it is clear that month end close has a tendency to close above midpoint of the month. In fact, the distribution is so skewed that it is 2 times more likely to get S&P to close in the top 20% range of the month than the bottom 20% of the range. This gives us good reason to not counter a developed up trend going into the last 2 trading days of a month when S&P was still trading below the top 20% area.
On the other hand, if S&P has pushed all the way up to print month high right before the month end, the chance for a decent pullback is slim until the month is over.
More Interesting Patterns Exist
There are many more interesting patterns exist related to end of month trading. They are not that difficult to spot but you have to keep an open mind. The important thing is that you should conduct your own investigations so that you are not misled by common beliefs that cannot withstand scientific scrutiny.
If you are interested in specific trading patterns and biases, you can check out the Emini S&P Patterns Library.
Trading Biases To Lean On During Month Ends


Month end is often depicted as the day that certain players would conduct window dressing to push the stock market higher. I have debunked the myth in the Survival Guide To Trading The Stock Market Month Ends. Now, we are looking into useful biases t ...