"Chart Pattern" Posts
Survival Guide To Trading The Stock Market Month Ends

End of month trading is different from other trading days because several classes of market participants would join the game during this time. Long side only funds often make adjustments to their portfolios during the last three to five trading days of a month. Long term investors also review the performance of their portfolios around […]
Complex Chart Patterns Are Just Combinations Of The Simpler Ones

Part of Art of Chart Reading Many traders are obsessed with the idea that there exists secret uber chart patterns that produce superior returns with virtually no risk involved. If you are one of them, you should reread what I have written from the beginning of this series. Maybe there exists such patterns but it […]
Weekly Bias: Emini S&P Post Trend Sell Week Play
Intraday Bias: Emini S&P Runaway Long (Signal ID – Runaway Long)
Intraday Bias: Emini S&P Easy Top (Signal ID – Easy Top)
Market Breadth Primer: Advance / Decline Spike Low

An interesting usage of advance / decline issues is to identify the market extremes. Here is one setup that has emerged as one of the best short term bottom picking signals since year 2000. Following chart marks the points where the signal occurred. The most powerful thing with this setup is that if the market […]
Weekly STOPD Pattern: S&P Bearish Continuation 1
The VIX Bearish Bias Play

The bearish property of VIX that no one talks about. If you need background information about the Volatility Index (VIX) please read The VIX Bullish Play. It has more background information about VIX that I do not want to repeat here. I am going to focus on the bearish trading setup here. First, the net […]
The VIX Bullish Bias Play

The Volatility Index from Chicago Board Option Exchange (VIX) is used to be a great tool for short term timing. It has many excellent properties that are useful for trading. Since the introduction of the VIX Future, however, many of these characteristics has changed. This modified behaviour has led to many famous long term timing […]
The One Bearish Setup Everyone Must Know Daytrading Emini S&P

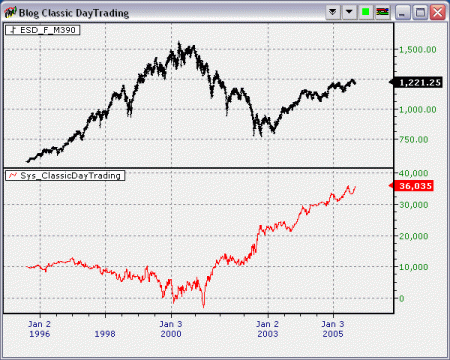
This trading setup is kind of complement pattern of the one presented in The One Bullish Setup Everyone Must Know Daytrading Emini S&P. It is short only, strictly day trade from open to close. It has been profitable all these years. Yet no one ever talks about it. Here is the dollar gain chart based […]


