"Technical" Posts
Setting Up Windows 10 for Serious Trading

After talking about Windows being ready for mission critical application last time, I guess it makes sense to explain what has to be done to turn a normal Windows 10 installation to something suitable for trading. There are several steps to carry out and a regular maintenance schedule to keep. Performance Setup 1. Open Control […]
Is Windows 10 Ready for Production Level Automated Day Trading?

Windows 10 was released back in year 2015. Back then it was new. It had many hardware incompatibilities and bugs that just crash without any warning. Windows 8 was a total write off. That leaves only Windows 7 as the viable option for traders to set up their trading computers back then. But what about […]
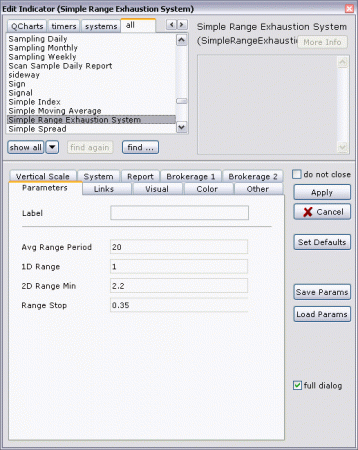
Range Based Look Back Technique

Indicator traders and trading system designers often use stock indicators from their trading platforms to construct their trading engagement methods and trading models. There are two problems when approaching the markets this way. First, you are using tools created by others that may have hidden issues. Specifically, it may not fit your risk profile while […]
Trading with Tick Index: Tick1K and its Divergence Signals

Someone asked what I mean by “custom tick divergence” in my real-time commentaries. Here are 5 charts (one day each) for the past week with Emini S&P, $Tick index and my DNO_Tick1K index. (You can expand them to full size for better viewing.) First of all if you do not know what Tick1K is then […]
Detecting Moving Average Crossover Before It Happens

Have you ever wish for the moving averages to crossover earlier? I am going to show you a way to detect moving average crossovers before they actually happen.
Basic Chart Reading – What is Divergence Anyway?

Since the first Basic Chart Reading article was written, I received many emails asking the fundamental question, “What is Divergence?”. I will try to explain what I know about this concept, hopefully, as precise as possible.
Stock Trading Using Stochastics (End of Day)

Stochastics is one of the most widely used technical indicators in the world. Surprisely, most traders like to modify the original indicator into something else because they find the original implementation too noisy. I am going to show you a trading setup using the original Stochastics SlowK indicator that works very well on daily data […]
Moving Average Is More Than What You Think – Part 3

Some readers are very forthcoming, they simply email me and complained to me for wasting their time in talking about moving average as something that is useful at all. I replied through email asking for their patience and wrapped up this third instalment as soon as I can. Moving average based trading systems still exist […]
Moving Average Is More Than What You Think – Part 2

We now know that moving average can be measured more effectively when average bar range is used as the yardstick. How do we utilitize this information?
Average Range vs. Average True Range – Which one is better?
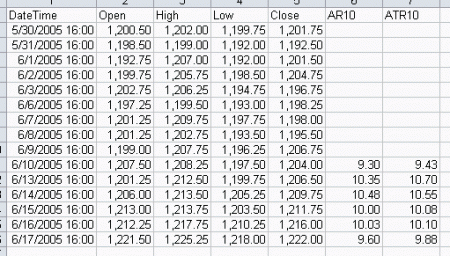
Many traders talk about ATR which stands for Average True Range, but from time to time you see indicators and technical analysis based on the Average Range, AR. So what’s the difference and which one is better?