"Tick Data" Posts
Anatomy of Orderflow at the Tick Level

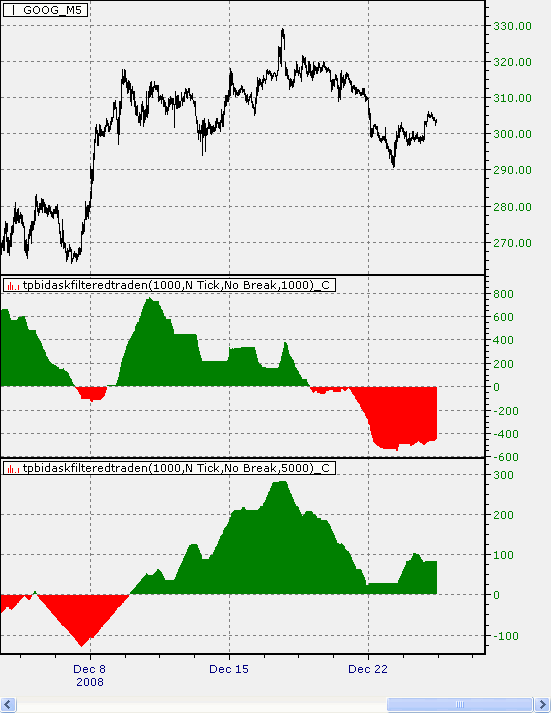
Many people asked why would anyone want to analyze the charts at the tick level. Wouldn’t that be a waste of time since such high frequency activities are not likely going to have any long term impact. Let’s take a look at this chart first. Top pane is Google stock price at 5-minute interval, since […]
Explosion in Emini S&P Trade Volume

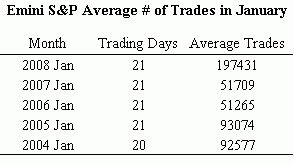
The table is showing the average number of trades per day in January over 5 year period. Back in 2004 and 2005, the average was around 90K and then decreased to around 50K in the following 2 years. This year, however, we have witness the biggest increase in emini trading activities. What does this mean […]
Post Hectic Environment Period
Working with the Current Hectic Market Environment
The trading environment since the beginning of May has been very different from most of the summers I have seen. Here are some tips to ensure your trading goes as smoothly as it can be.


