"Dow" Posts
MBO Issue 54 (Jun 2016) Special Update

Jun 26, 2016 Special Update for S&P 500 and Euro. The BREXIT outcome from last week produced very volatile reactions across all the major markets. The custom breadth pointed us at the right direction to look for downside breakout only. Now that we have confirmed weaknesses, what are we supposed to do? (premium member […]
Planetary Forces: Its Effects On Earth and the Stock Market

Using physics, one can calculate the net forces happening on the surface of Earth. This force is known to be the direct cause of tides and other short term natural phenomenon. However, seldom anyone talks about the long term implications of this force and our ecosystem. In this piece, I am going to present an […]
The Headlines We’ve Been Waiting For
A bunch of headlines to think about: Jun 24, 2014 Bull markets don’t die of old age, why Dow 44,000 is coming Jun 23, 2014 Fed gives ‘green light’ for Dow 18K: Siegel May 31, 2014 ‘For The First Time In Forever,’ The Dow Will Hit The Magic 18,000 Zone There are more if you […]
Kicking It Up A Notch In Managed Market
Zerohedge reported how an absolutely orderly market being manipulated at the highest level in favour of some participants. This Selling Will Not Stand, Man: NYSE To Bust 17 Minutes Of Option Trades (When Market Dropped) Now I understand why all 3 indices are forced to go higher. The new normal – you can bet on […]
What Really Happens During Election Years

Following is the daily composite average of Dow during election years since 1932. The chart shows the average values from the first trading day up to the last trading day. The green line is the composite high. The blue line is the composite close. And the red line is the composite low. As of Oct […]
Black Swan 2 – A Simple End of Day ETF Strategy That Works

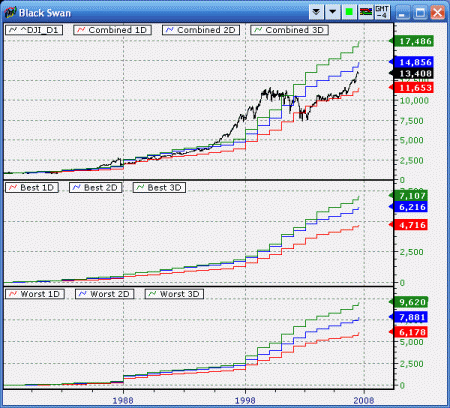
Some time ago I wrote an article titled The Black Swan that explains the fundamental problem with buy-and-hold strategy when applied onto stock market. This time we are going to take a look at the first of several strategies that can beat buy-and-hold strategy hands down in terms of better risk control and capital deployment.
April’s Fool Day Phenomenon
One of the very rare calendar date based statistical bias happens on April’s Fool. No joke! The Phenomenon March 30 and March 31 each date produces an accumulated -15% return (non-compound, close to close) on Dow or S&P 500. Then on April’s Fool, a whooping +15%. It is not the strongest performer in terms of […]


We Have Seen This Stock Market Environment Before
The following chart shows the weekly bars of Dow, S&P 500 and Nasdaq 100 since the beginning of 2016. Many people questioned how come we have never seen this before. In fact, there is no match from historical data to the way how these markets performing lately. But, there is indeed a near perfect match. […]